 Some 49.6 percent of the $8.365.9M frame market dollars spent in the US last year were spent at independent optical practices, including those owned by ODs, ophthalmologists and opticians, according to the Vision Council’s VisionWatch December 2011 Consumer Barometer report. Some 27.9 percent was spent with corporate-owned retailers, while 11.5 percent was spent with mass merchandisers; 4.9 percent was spent at optical centers in department stores; and 6.2 percent was spent with unnamed “other” retailers.
If about half of patients are buying frames from independent practices, how do we attract the other half to buy from us? The first place to start is to look at the patients coming through your practice who have frame coverage from their vision insurance. What is your capture rate on these patients? This will tell you if you have a problem in your practice.
To manage this area of the practice, take the following three actions today:
1. Track the percentage of people with vision insurance coverage who buy new frames from you rather than either using their old frame or taking their prescription and buying frames from someone else. Your capture rate for this group of people should be in the 90 to 95 percent range.
2. Track the reasons people do not buy new frames from you. To fix a problem you need to identify the problem.
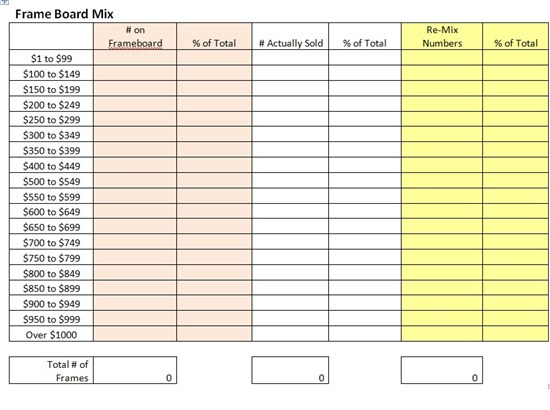
3. Look at your frame board mix and compare that to what you are actually selling. Do this by price points. Remix to maximize sales. Use the following chart to help you with this project: