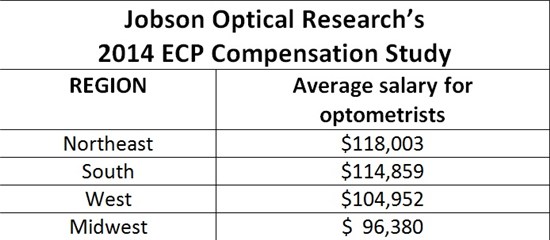
 ODs in the Northeast have nothing to complain about money-wise, findings from Jobson Optical Research’s 2014 ECP Compensation Study suggest. The average salary for all optometrists who reported receiving a salary was highest in the Northeast region at $118,003 and lowest in the Midwest at $96,380. The South came in at $114,859 and the West at $104,952.
Click HERE to purchase Jobson Optical Research’s 2014 ECP Compensation Study.
Are you in control of your money and your life? To find out, here are three questions you need to answer:
1) How much do you make?
2) How much do you keep?
3) Is your money working effectively for you?
First, let’s ask the question: How much do you make?
What is your average salary? Jobson has provided answers for the average salaries across the country. The Jobson Optical Research’s 2014 ECP Compensation Study is summarized in the chart below.
Let’s put these numbers in perspective. The median household income has been dropping over the last few years. The current number is $51,017. For contrast, look at 1999, where the peak median household income was $56,080. The trend over time is a decreasing number. This decrease in median income has economists talking about the lost decade.
Here’s a chart from the US Census Bureau showing how the household income varies across the US.
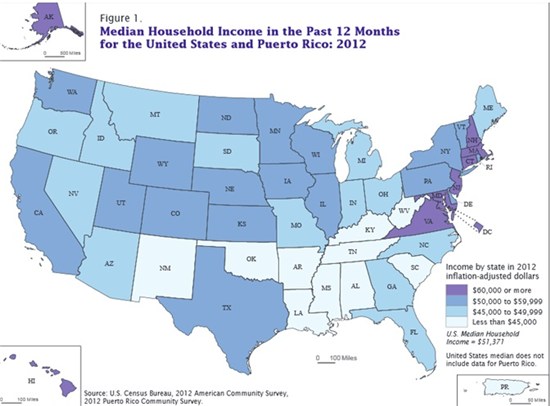
Combining Jobson Optical Research’s 2014 ECP Compensation Study and the US Census Bureau chart, you can see why variations in optometric income exist.
Second, how much money do you keep?
Carelessness in this stage can easily cause money to disappear. Pay careful attention to these three steps.
1) Have you reduced your tax exposure? You should pay your taxes, but there is no need to over-pay your taxes. Make sure you have talked to your CPA about your tax exposure and how to reduce it legally.
2) One-half to two-thirds of your take-home money goes to pay for food, housing and transportation. Make sure you are managing these three areas effectively.
3) Now you need to examine savings, household expenses, professional expenses and entertainment. Take these five steps to help take control of your spending:
a. Pay savings first
b. Set priorities for the rest of the items
c. Budget for a year, then break it down into a monthly budget
d. Write down everything you spend for two weeks
e. Reward yourself for sticking to the budget
Third, is your money working effectively for you?
Here are five questions to answer to find out if your money is working effectively for you:
1) Do you know the difference between saving and investing?
2) Does your invested money double every seven years (sooner is better)?
3) Do you understand the time value of money?
4) Do you have a specific money goal for your investing and a written plan to get there?
5) Do you have a specific time frame for your investing and a written plan to get there?
It’s your money. It’s your life. Make today the day you take control of your money and your life.
Consider also:
Decades after the Great Recession ended, 46.5 million Americans are still living in poverty, according to a Census Bureau report.
Meanwhile, median household income fell slightly to $51,017 a year in 2012, down from $51,100 in 2011–a change the Census Bureau does not consider statistically significant.

Taking a wider view reveals a larger problem: Income has tumbled since the recession hit, and is still 8.3 percent below where it was in 2007.
“We’ve had [economic] growth, but it hasn’t really reached everyday Americans,” said Elise Gould, an economist at the left-leaning Economic Policy Institute. “It’s a lost decade, maybe more.”
This long-term decline in income is troubling to economists, especially as the middle and lower classes have fared considerably worse than the rich. Since 1967, Americans right in the middle of the income curve have seen their earnings rise 19 percent, while those in the top 5 percent have seen a 67 percent gain. Rising inequality is seldom a sign of good social stability.
Americans were the richest in 1999, when median household income was $56,080, adjusted for inflation.
Related: Who’s to blame for income inequality?
Who is earning the most: Young people continued to struggle last year, with those under the age of 35 seeing slight drops in income while those 35 and older made some gains.
Women made 77 percent of what men made, unchanged from the year before, but up from 61 percent in 1960. Over one million men found full-time work last year, as the economy recovered. Some have dubbed the most recent recession the “mancession,” as large numbers of men have left the workforce.
Asians had the highest household income ($68,600), followed by whites ($57,000), Hispanics ($39,000) and blacks ($33,300).
Related: 48 million Americans without health insurance.
How the poorest are faring: The recession also pushed many more people into poverty. In 2010, the poverty rate peaked at 15.1 percent, and has barely fallen since then. This is the first time the poverty rate has remained at or above 15 percent three years running since 1965.
Those making $23,492 a year for a family of four, or $11,720 for an individual, were considered to be living in poverty.
While the ranks of the poor are still elevated from the recession, overall poverty is remains far below the 22.4 percent it was at in 1959 when the Census first began tracking the data. Over the last 25 years, the poverty rate has averaged just over 13 percent.